
Robots Can Do 74 Percent of the Physical Work, and Almost None of It Pays
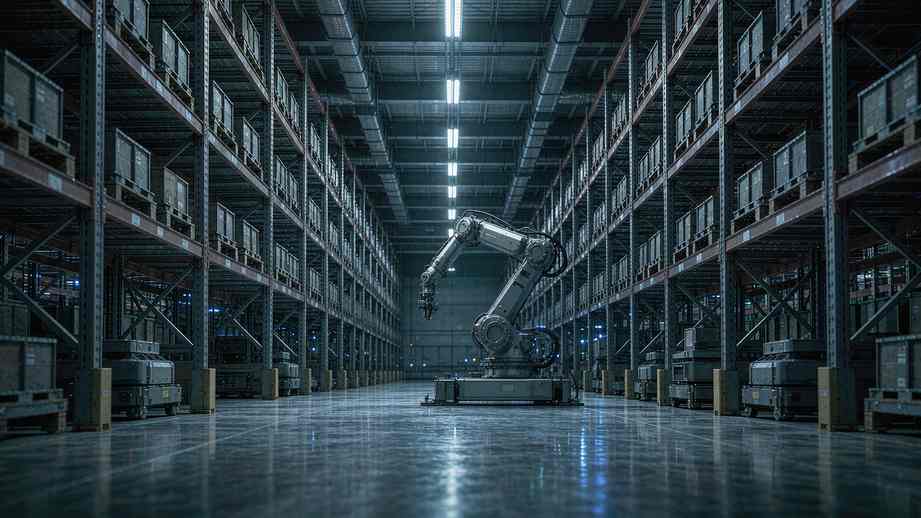
Anthropic published a study on 30 September that puts two numbers next to each other, and the gap between them is the whole argument.
The first number is 74 per cent. Robots that exist today can perform 74 per cent of physical job tasks in the United States, at least in some setting. Those tasks account for 34 per cent of all working hours. The second number is 0.3 per cent, which is the share of work for which a robot is currently cheaper than the human doing the job.
Capability is largely there. The economics are not. That reframing is the useful contribution of the paper, written by economists Russell Legate-Yang and Maxim Massenkoff.
How the index was built
The study starts from O*NET, the US occupational database covering around 900 occupations and roughly 19,000 task descriptions. Claude first sorted the tasks into physical, cognitive, and interpersonal work, which flagged 7,594 as physical. Then it searched the web for real robots capable of each task and rated them.
The rating scale is the clever part, because it grades tasks by how much structure the environment needs. E0 means no robot can do it today. E1 means a robot can do it in a purpose-built space, such as an assembly line. E2 means a structured human workplace, such as a logistics warehouse. E3 means an unstructured environment, such as a city road.
Only demonstrated capability counted. Every rating had to cite a deployment, a commercial sale, or a demonstration, and the authors say the results hold up if demonstrations are dropped.
That scale produces a much more honest picture than a single capability score. A robot that only works on a factory floor and a robot that works on a public street pose very different threats to a job, and the index says so rather than averaging them together.
Where the 74 per cent actually lives
Most robot-doable work is doable only when the workplace is rebuilt around the robot. The E1 and E2 categories together account for 33 per cent of working hours, and open-world robots, the E3 tier, cover just 1 per cent.
The occupational pattern is sharp. Driving dominates completely. Nine of the ten most exposed occupations with at least 20,000 jobs are vehicle operators, which follows from autonomous cars, trucks, tractors, and pavers, with Waymo cited for taxi tasks. Taxi drivers top the index at 2.2 out of 3. Warehouse work comes next, where robots such as Amazon's touch-sensing Vulcan pick and stow merchandise, and recycling sorters have more than three quarters of their task time rated E2.
Nursing and general repair sit near the bottom. Present-day robots can do little of that work even in controlled settings, which says something about how much of care and repair comes down to dexterity and reading a situation rather than following a procedure.
The workforce profile is close to the inverse of exposure to language models. Comparing workers in the top fifth of the robot exposure index with unexposed workers, they are 20 percentage points less likely to be female, 16 points more likely to be Hispanic, 55 points less likely to hold a bachelor's degree, paid around $30 less per hour, and face an unemployment rate more than twice as high.
Forty years to ten per cent
The cost scenarios are where the optimism in the capability number runs out. If robot prices keep falling at roughly 3 per cent a year, the pace that has held since the 1990s, it takes about 40 years for robots to be cost-competitive for 10 per cent of human work. A separate baseline scenario puts the point at which robots beat human cost for half of physical work in 2085.
An alternative fast scenario reaches cost competitiveness for half of today's physical work by 2050, but it assumes costs fall up to four times faster and capabilities improve twice as quickly. The authors are explicit that these are modelled outcomes, not predictions about when jobs disappear.
The study also bolts the robot index onto existing work on language model exposure. LLMs alone expose around half of work. Adding any robot that can do a task at E1 or higher raises that to 81 per cent. Transport and moving goes from under 15 per cent exposed to roughly 90 per cent. Office and administrative support approaches nearly total exposure, because the light physical tasks a chatbot could not handle turn out to be robot-shaped.
One methodological caution is worth carrying. Combining task-level cost estimates into whole occupations can count the same robot more than once, or miss the coordination costs of running several together. The authors flag this themselves, and it means the aggregate figures are directional rather than precise.
Why the environment scale is the right axis
Most automation forecasts treat capability as a single dial. The study's four-tier scale replaces that with something closer to how deployment actually works, which is a question of how much order the robot needs around it.
The distinction explains why the numbers look the way they do. A warehouse is a structured human workplace, so a robot can be dropped into a task there without rebuilding the building. A city street is not, so the robot has to handle everything a person does, including the parts nobody wrote down. That gap between E2 and E3 is where the difference between 33 per cent and 1 per cent of working hours lives.
It also explains why robots struggle with jobs that look simple from the outside. General repair involves a sequence of small judgements about a situation the robot has never seen, which pushes it toward E0 even though each individual motion is well within reach. The scarcity is not dexterity alone. It is the ability to operate in a world that was not designed for you.
Where the study's own caveats matter
Two limitations are worth holding while reading the headline figures. Combining task-level costs into whole occupations can count the same robot more than once, or miss the coordination costs of running several together, and the authors say so directly. That makes the aggregate numbers directional rather than precise.
The second is that capability ratings rest on documented deployments, sales, and demonstrations. That is a stricter standard than a research paper, and a more generous one than a shipped product. A robot that has been demonstrated once counts as able to do a task, which will read as optimistic to anyone who has watched a demo fail in a real facility.
Neither caveat changes the shape of the finding. Both constrain how much weight a single figure should carry.
What the numbers are actually saying
There is a temptation to read the 74 per cent as a threat and the 0.3 per cent as a reprieve. Both readings miss the interesting part, which is the relationship between them.
A 50-year backtest supports the method: occupations more exposed to robots in 1977 did see larger wage and employment declines in the decades that followed. Exposure predicts pressure, eventually. What it does not predict is speed, and the cost curve is what sets the speed.
The study's own framing is the one worth keeping. Automation arguments usually run on capability, as though the only question were whether a machine can do the job. This paper flips that: the capability is substantially there, the price is not, and four decades to ten per cent is not a forecast that justifies panic or complacency. It is a description of a bill that has not come due yet.
Related articles
A Wheeled Semi-Humanoid Finished an Hour of Laundry Without Help
Individual tasks can succeed while a workflow still fails. Dyna changed the metric.
LTX 2.5 Wants to Render Your Blocky Blender Draft Into a Finished Shot
You do not control what happens in text-to-video. This tries to fix that.
ServiceNow Turns Agent Failures Into Training Data
Generation without verification is noise. The gates are the product.
One Framework for Language and Vision: Horizon's 1.6B Open Model
A bet that the bridges between language and vision were never needed.